"Connecting Art with Passion, Value with Precision"
Ravenel Art Auction App is a mobile application designed for art collectors, investors, enthusiasts, and occasional buyers to participate in online auctions. The app was looking to enhance user engagement and cater more specifically to the needs of each user type. Using a combination of qualitative and quantitative research, the team analyzed user behavior and preferences, segmented into four main personas.

Client
Ravenel International Art Group
Role
Product Manager, Creative lead
Year
2017-2018
Team
2 UI/UX designers, 1 UX researcher,
2 software engineers

Needs
Love for art, interest in exploring new works.
Enjoy browsing artists' works, participating in auctions, or social sharing.
Behavioral Traits
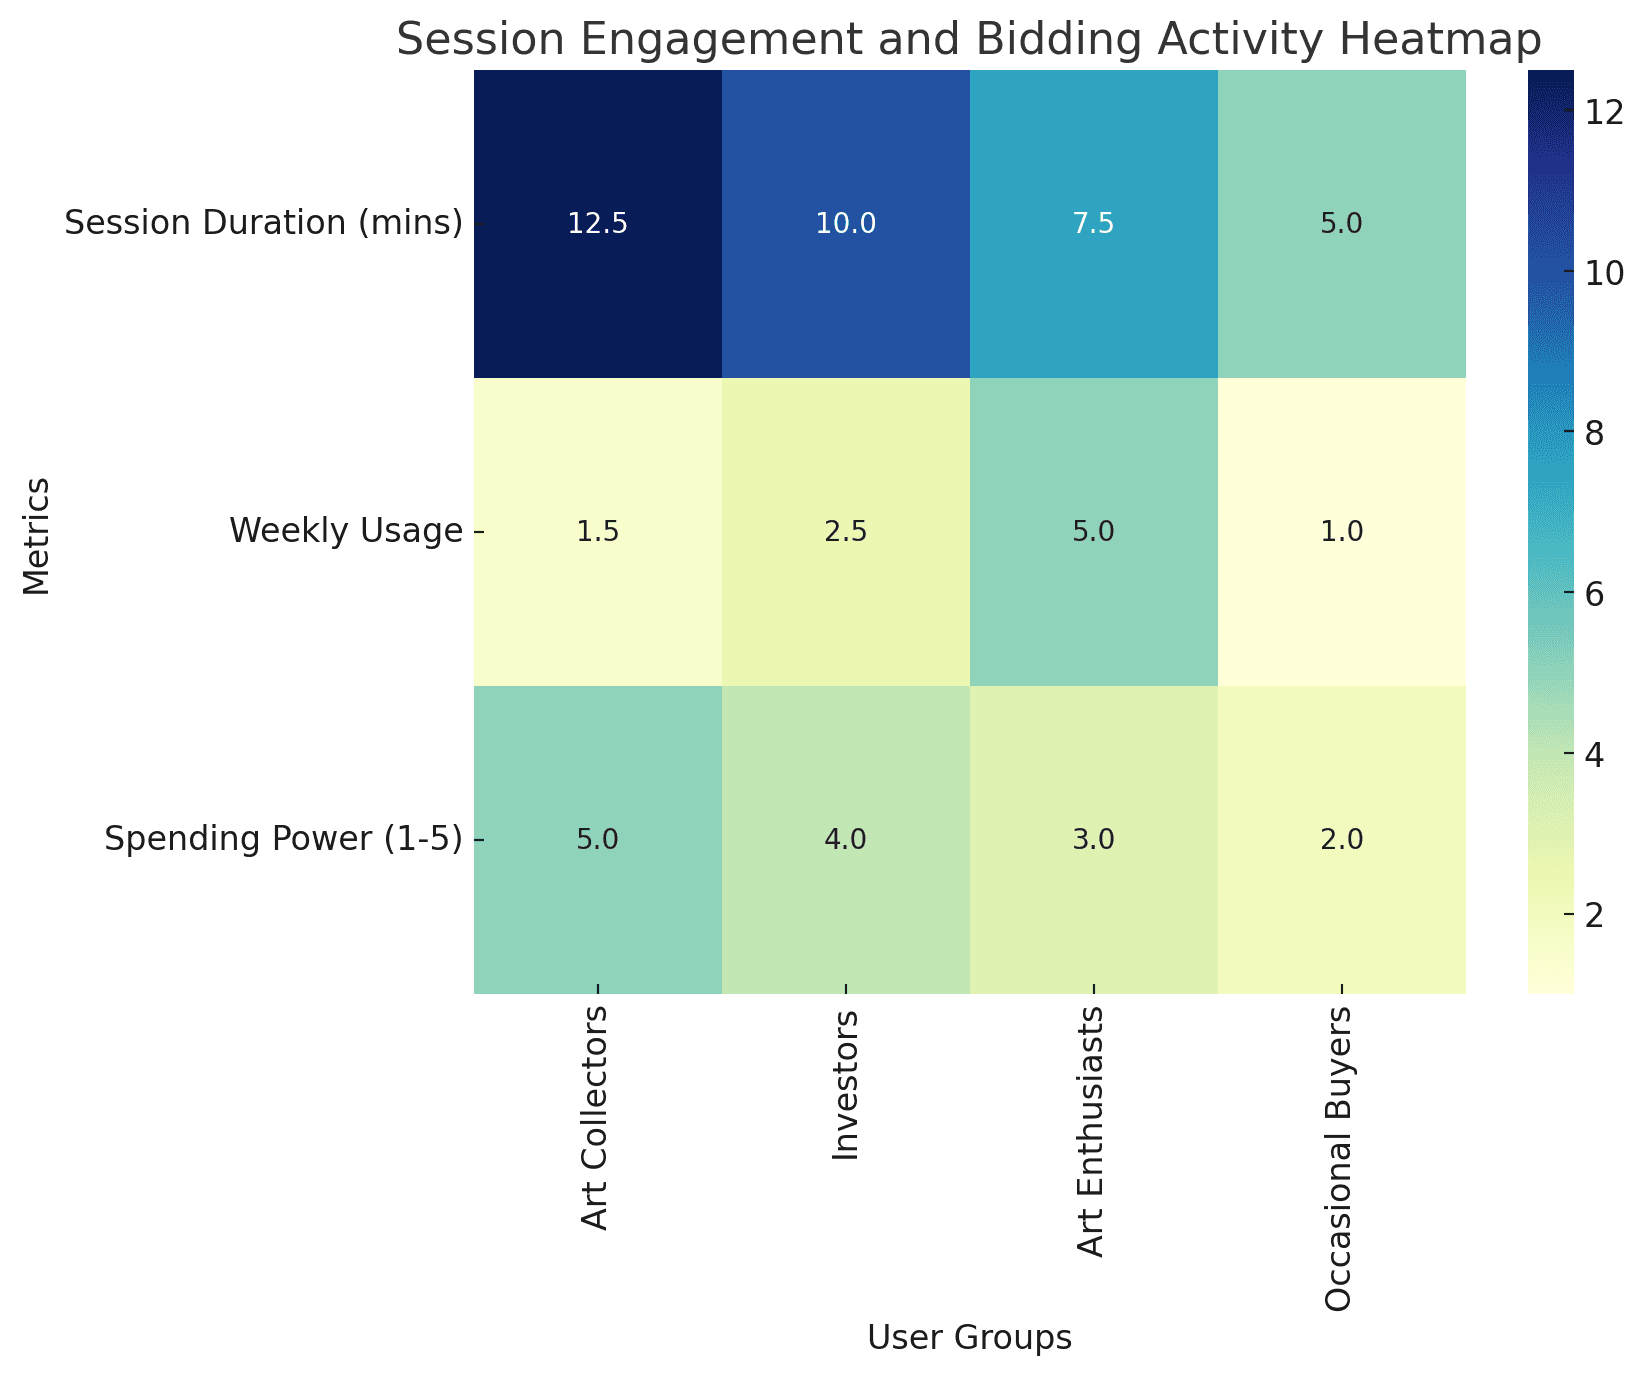
Session Duration: Average 7.5 minutes, shorter, indicating casual browsing.
Usage Frequency: About 5 times per week, frequent visits, like exploring new works.
Bidding Preference: Prefer last-minute bidding, spontaneous and competitive.
Feature Preferences
Artist introductions, high-definition displays, bidding and purchasing experiences, social sharing.
Inferred Data
Average Bid Amount: Estimated $500-$2,000
Social Sharing Rate: Approximately 30% of viewed items
Time Spent on Artist Information: About 35% of session time
Needs
View artworks as investment tools, focus on market value and appreciation potential.
Require valuation ranges, transaction records, and market trend information.
Behavioral Traits
Session Duration: Average 10 minutes, moderate, focus on data and market information.
Usage Frequency: About 2.5 times per week, tracking specific investment opportunities.
Bidding Preference: Cautious, prefer incremental bidding based on data-driven decisions.
Feature Preferences
Personalized recommendations, valuation tools, auction reminders, quick purchase options.
Inferred Data
CAverage Bid Amount: Estimated $5,000-$8,000
Time Spent on Market Analysis: Approximately 50% of session time
Return on Investment (ROI) Expectation: 10-15% annually
Needs
Interest in entry-level artworks, low purchase frequency.
More emphasis on the simplicity of the purchasing process.
Behavioral Traits
Session Duration: Likely shorter, focus on basic functions.
Usage Frequency: Variable, depending on purchase needs.
Bidding Preference: Simple, direct purchasing methods.
Feature Preferences
Simple bidding process, convenient purchase options.
Inferred Data
Average Bid Amount: Estimated $100-$500
Conversion Rate: Estimated 5-10% per session
Time Spent on Price Comparison: About 45% of session time

Needs
High demand for artwork uniqueness, historical value, and detailed provenance.
Preference for quick access to item background and transaction history.
Behavioral Traits
Session Duration: Average 12.5 minutes, longest, indicating deep information exploration.
Usage Frequency: About 1.5 times per week, only when interested in specific auctions.
Bidding Preference: Prefer early bidding and incremental increases, less likely to bid at the last minute.
Feature Preferences
Wishlist, automatic bidding, transaction notifications, expert consultation, private purchases.
Inferred Data
Conversion Rate: Estimated 15-20% per session
Time Spent on Provenance Information: Approximately 40% of session time
User Metrics Comparison
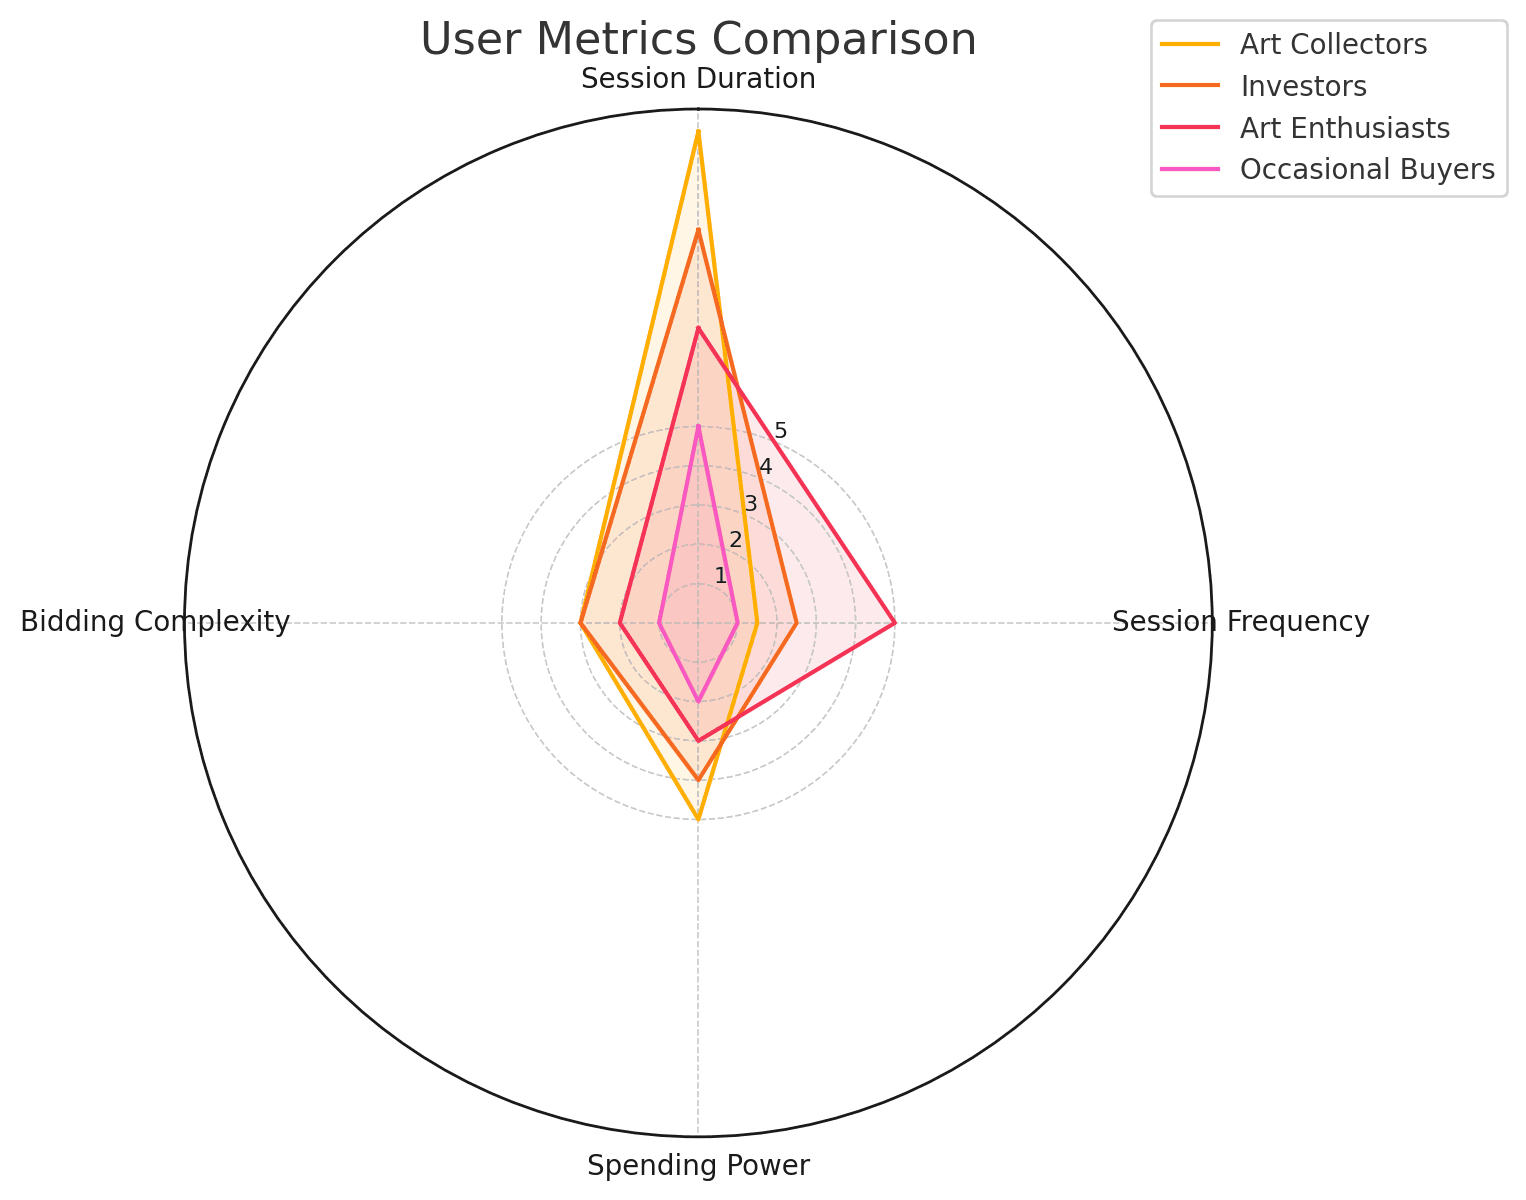
Radar Chart of Behavioral Traits

Radar Chart of Behavioral Traits
Age Distribution by User Group
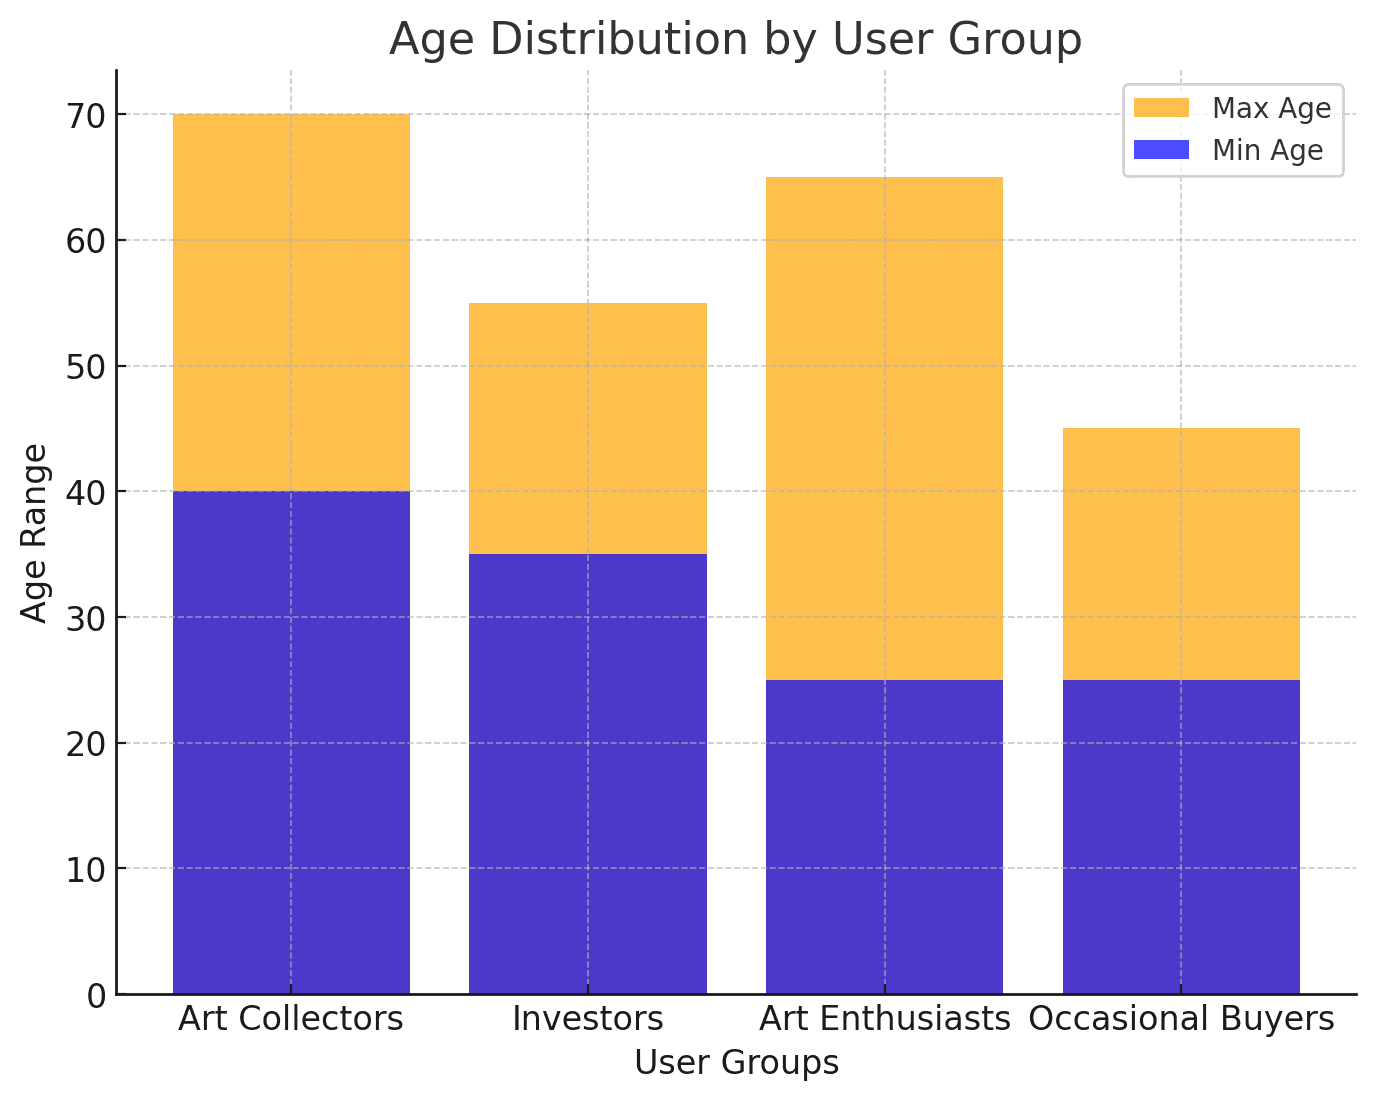
Age Distribution by User Group
comprehensive artwork information gap
real-time bidding dynamics and comprehensive artwork information
Exploring Our Customers!!
Goals for Target Audience Research

1. Target Market Positioning
Average Age and Primary Age Range confirm the core user base of the application, ensuring that product design and marketing strategies align with their needs.
2. Consumer Behavior & Pricing Strategy
Average Spending indicates the purchasing power of different user groups, helping businesses tailor their offerings accordingly.
High-spending users may require exclusive services.
Lower-spending users may respond better to discounts or promotional offers.
3. Feature Development Prioritization
Preferred Features help product teams prioritize functionalities that resonate with target audiences, increasing user retention.
Investors may prefer market analysis tools.
Art enthusiasts may value social sharing and discovery features.
4. Marketing Messaging & Promotion Strategy
Key Motivations assist in crafting targeted marketing messages.
Investors respond to ROI-driven campaigns..
Art lovers may be more engaged by new artwork recommendations or artist stories.
5. Market Expansion & Risk Assessment
Expanded Age Range and Added Potential Age Range indicate how broadening the audience affects the user base, attracting younger or older demographics.
Increase in Average Age (%) measures whether this change aligns with the brand’s positioning.
Opportunities with Expansion and Challenges with Expansion help evaluate whether targeting a broader audience is worthwhile.
Younger users may require a more intuitive UI and social features.
Older users may prioritize security and professional guidance.
6. User Engagement with the App
App Engagement Potential helps predict which user groups are most likely to interact with the app, allowing for an optimized user experience and marketing approach.
Conclusion
This table provides valuable insights into different user segments within the art auction market, helping to optimize product design, marketing strategies, and user engagement.
For targeted growth, focusing on core user behaviors (e.g., spending patterns and feature preferences) ensures higher conversion rates.
For market expansion, understanding the impact of broadening the age range helps predict new opportunities and potential challenges.
For app engagement, aligning features with key motivations can increase user retention and interaction.
By leveraging these insights, businesses can enhance customer experience, improve revenue potential, and strategically expand their user base while maintaining a strong brand identity.
Qualitative Research
Interviews
Conducted in-depth interviews with 20 users across all personas to understand motivations, challenges, and app preferences
Focus Groups
Held two focus group sessions to gain insights on user experience, discussing bidding preferences, navigation ease, and interest in social features.
Usability Testing
Observed 15 users as they performed tasks like bidding, browsing collections, and accessing provenance information to identify areas for improvement.
Quantitative Research
surveys
Collected responses from 500 app users to determine preferences for features such as bid alerts, real-time data, and social sharing options.
A/B Testing
Tested two versions of the bidding interface to compare engagement and ease of use, resulting in a 20% increase in bidding activity with the optimized version.
Data Analysis
Analyzed user metrics including session duration, click-through rates, and bidding frequency, identifying patterns that informed new feature prioritization..